 DENVER REAL ESTATE | COLORADO LIFESTYLES
The short answer
The market summary labeled Denver Metro shows overall showing traffic declining from 18,818 to 17,050 over six weeks—a 9.4% decrease. In the selected price bands from $600,000 to $1.35 million, listings averaged about 1.77 to 1.83 showings per week. In my experience, 10 to 15 showings often creates enough exposure for a serious buyer to emerge. At roughly 1.8 to 2.0 showings per week, accumulating that exposure can take about five to eight weeks, so a month or more on market should not automatically surprise a seller. That is a planning benchmark, not a promise that a particular number of showings will produce an offer.
What happened to Denver metro showing traffic over the past six weeks?
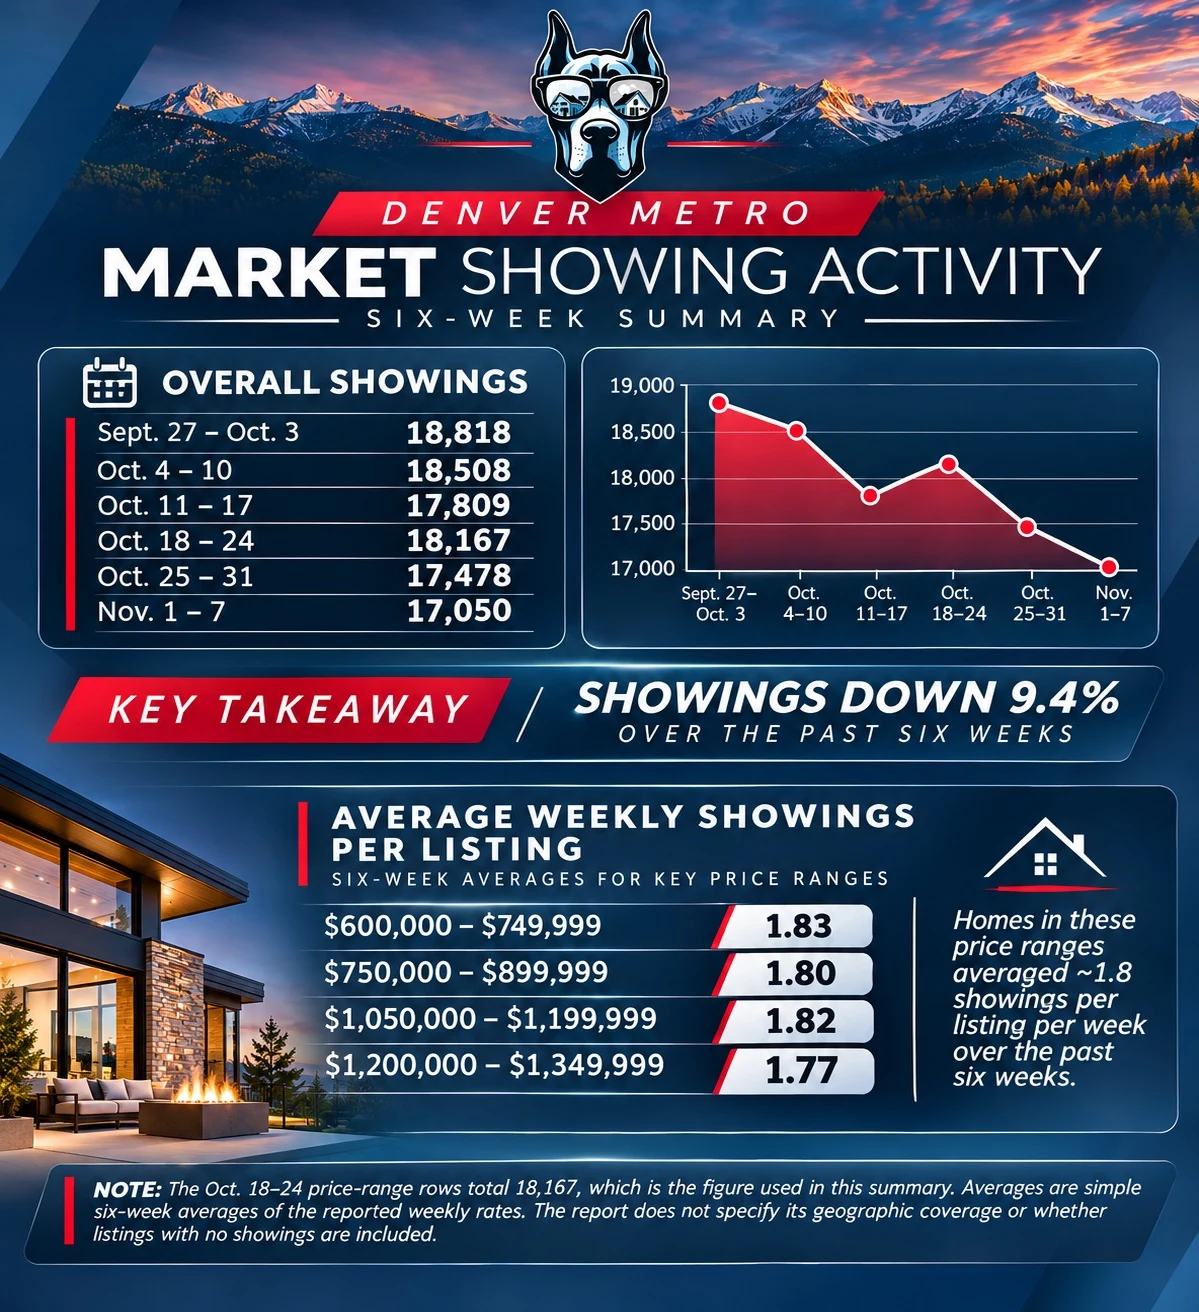
The summary reports 18,818 showings for September 27 through October 3 and 17,050 for November 1 through 7. That is a decline of 1,768 showings, or approximately 9.4%. Across all six periods, the average was approximately 17,972 showings per week.
| Reporting period | Overall showings | Change from prior week |
|---|---|---|
| Sept. 27–Oct. 3 | 18,818 | Starting point |
| Oct. 4–10 | 18,508 | −310 |
| Oct. 11–17 | 17,809 | −699 |
| Oct. 18–24 | 18,167 | +358 |
| Oct. 25–31 | 17,478 | −689 |
| Nov. 1–7 | 17,050 | −428 |
The path was not a straight line—traffic rebounded during October 18–24—but the six-week direction was lower. That can reflect seasonal behavior, changing inventory, affordability, mortgage rates, holidays and other factors. The figures show what happened; they do not establish why it happened.
How much showing activity did listings receive at different price points?
The selected price bands in the summary were remarkably close. They averaged between 1.77 and 1.83 showings per listing per week, despite spanning from $600,000 to nearly $1.35 million.
| Selected price range | Average showings per listing per week | Approximate showings in four weeks |
|---|---|---|
| $600,000–$749,999 | 1.83 | 7.3 |
| $750,000–$899,999 | 1.80 | 7.2 |
| $1,050,000–$1,199,999 | 1.82 | 7.3 |
| $1,200,000–$1,349,999 | 1.77 | 7.1 |
These are selected ranges, not every price point in the Denver metro market. Still, the narrow spread provides useful context: the listings represented in all four ranges were generally receiving fewer than two showings per week. A well-positioned individual home can outperform that pace, while an overpriced or poorly presented home can receive less activity—or none.
How does the 10-to-15-showing benchmark translate into time?
Here is my agent perspective: historically, I have often felt that 10 to 15 showings is the amount of exposure it takes for a buyer to write an offer. It is not a rule. I have seen the right buyer write after the first showing, and I have seen listings accumulate more than 15 showings without an offer. But it is a useful expectation-setting benchmark because buyers need a chance to discover, compare and emotionally connect with a home.
At the current reported pace, the math takes longer than many sellers initially expect:
| Weekly showing pace | Time to 10 showings | Time to 15 showings |
|---|---|---|
| 2.0 per week | 5.0 weeks / 35 days | 7.5 weeks / about 53 days |
| 1.8 per week | 5.6 weeks / about 39 days | 8.3 weeks / about 58 days |
This does not mean every home should expect a contract on day 35 or day 58. It means that at 1.8 to 2.0 showings per week, it may take five to eight weeks simply to accumulate the level of exposure that I often associate with a serious offer opportunity. That helps explain why an average market time of a month or more can coexist with active buyer demand.
What should sellers expect during the first month on market?
At a pace of roughly 1.8 showings per week, a listing might receive only three or four showings in its first two weeks and approximately seven in four weeks. That can feel slow to a seller who remembers markets in which multiple buyers arrived during the first weekend. In the current environment, however, the better question is not simply, “Why hasn’t it sold?” It is, “How is our home performing relative to the alternatives buyers can see?”
I would evaluate:
- Showing pace: Is the home receiving more or fewer showings than comparable active listings?
- Digital engagement: Are buyers saving, sharing or repeatedly viewing the listing before scheduling?
- Showing feedback: Are comments pointing to one repeated objection about price, condition, layout or location?
- Competition: Did a similar home enter the market, improve its price or go under contract?
- Conversion: Are showings producing second visits, disclosure requests or agent questions?
Patience should be informed by evidence. Waiting without measuring the response is not a strategy.
When is slow showing traffic a pricing or presentation signal?
Low traffic and low conversion are different problems. If a home receives almost no showings while nearby alternatives are being toured, the market may be rejecting the price, the online presentation, access restrictions or a combination of those factors. If the home receives showings but no second visits or offers, buyers may be identifying a value or condition objection after they arrive.
That distinction matters. A price adjustment can help a listing enter a new search range and improve perceived value, but price should not be the only lever. Professional photography and video, accurate feature descriptions, thoughtful staging, showing readiness and convenient access all influence whether online attention becomes an in-person visit—and whether a visit becomes an offer.
I prefer defined review points rather than emotional daily reactions. We can compare actual traffic with the relevant competitive set, identify patterns in feedback and decide whether to hold, improve presentation or reposition the price.
Can stronger marketing help a home outperform the average?
Yes, although no marketing plan can manufacture demand or guarantee a sale price. The purpose of high-end listing media and targeted distribution is to earn a larger share of the available buyer attention. When total showing traffic is declining, that competition for attention becomes even more important.
A successful launch should give buyers a clear answer to three questions: Why this home? Why this location or lifestyle? Why does the value make sense compared with the alternatives? Professional photography, video, floor plans, social advertising and a disciplined pricing strategy work together to make that answer easier to see.
The market average is context—not a ceiling. A home with the right price, positioning and presentation can create urgency even when broader traffic is slower.
What are the limits of this showing report?
The summary itself notes that the price-range figures are simple six-week averages of the reported weekly rates. It also says the underlying report does not specify its geographic coverage or whether listings with zero showings are included. Although the graphic is labeled “Denver Metro,” those limitations mean the figures should be treated as directional context rather than a precise forecast for every city, neighborhood or property type.
Showing activity also does not equal unique buyers, and an average can hide major differences between homes. Property condition, price, location, architecture, monthly payment, HOA or metro-district costs, marketing quality and available competition can all change the outcome.
The right way to use this report is to establish a reasonable baseline and then measure a specific listing against its own competitive market.
Common questions
Is 1.8 showings per week good for a Denver-area listing?
It is close to the six-week averages shown for the selected $600,000 to $1.35 million price bands. Whether it is good for a specific listing depends on its neighborhood, property type, price, condition, competition and marketing response.
How many showings does it usually take to receive an offer?
There is no required number. In Dane Rickard’s professional experience, 10 to 15 showings often represents meaningful exposure for a serious buyer to emerge, but an offer can arrive sooner—or not arrive after many more showings.
Does 10 to 15 showings guarantee an offer?
No. It is an experience-based planning benchmark, not a guarantee. Price, condition, location, financing costs, competition and buyer feedback all affect whether showing activity converts into an offer.
Should a seller reduce the price after two weeks?
Not automatically. At roughly 1.8 showings per week, two weeks may produce only three or four visits. The decision should compare the home’s traffic and feedback with similar active listings and consider presentation, access and new competition.
Why do some homes sell quickly when overall showing traffic is down?
Market averages combine many different listings. A well-priced, well-presented home that offers a strong value or scarce feature can outperform the average, while a competing home may receive little activity.
Sources & related reading
Sources reviewed November 9, 2026.
Let’s read your showing traffic in context.
I can compare your home’s activity, feedback and competition, then turn the response into a clear pricing and marketing decision.
Plan Your Selling Strategy ↗